Trace Viewer#
The Trace Viewer module makes use of the SWO output to collect very high-frequency data from the target device. It allows you to profile interrupts or display high-speed signals in the form of plots. It has almost no runtime overhead-only a single register write is needed per data point.
Note
Trace Viewer is available on cores that support SWO. Cortex-M0 and Cortex-M0+ are not supported.
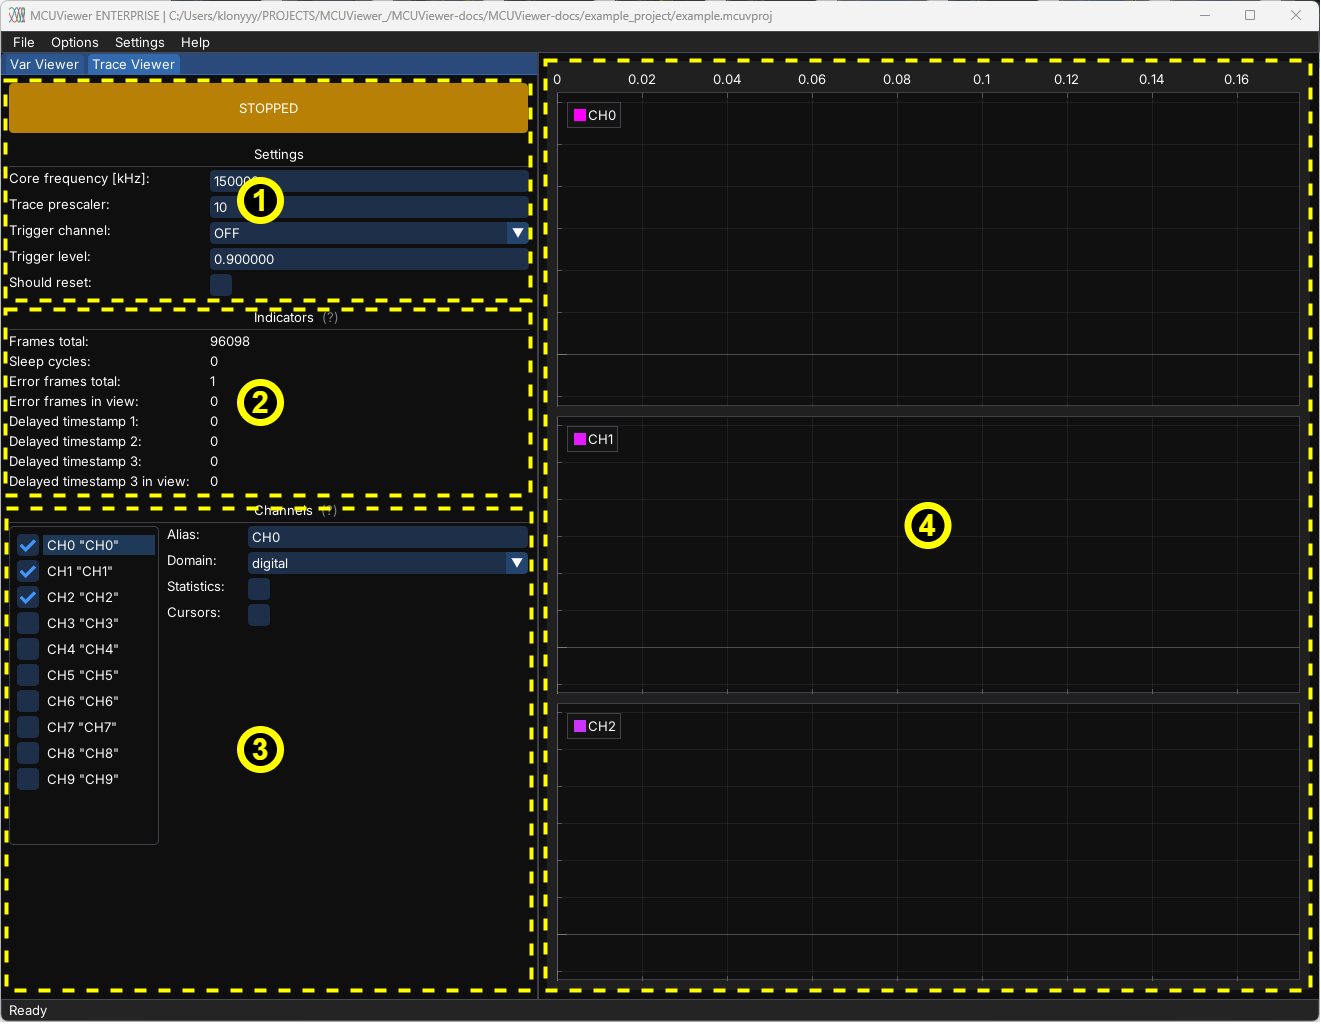
Trace Viewer window consists of four main parts:
Control panel - main control panel.
Indicators - trace status and error indicators.
Channels list and settings - list of all channels and quick-access settings.
Channels canvas - plots are drawn here.
Control panel#
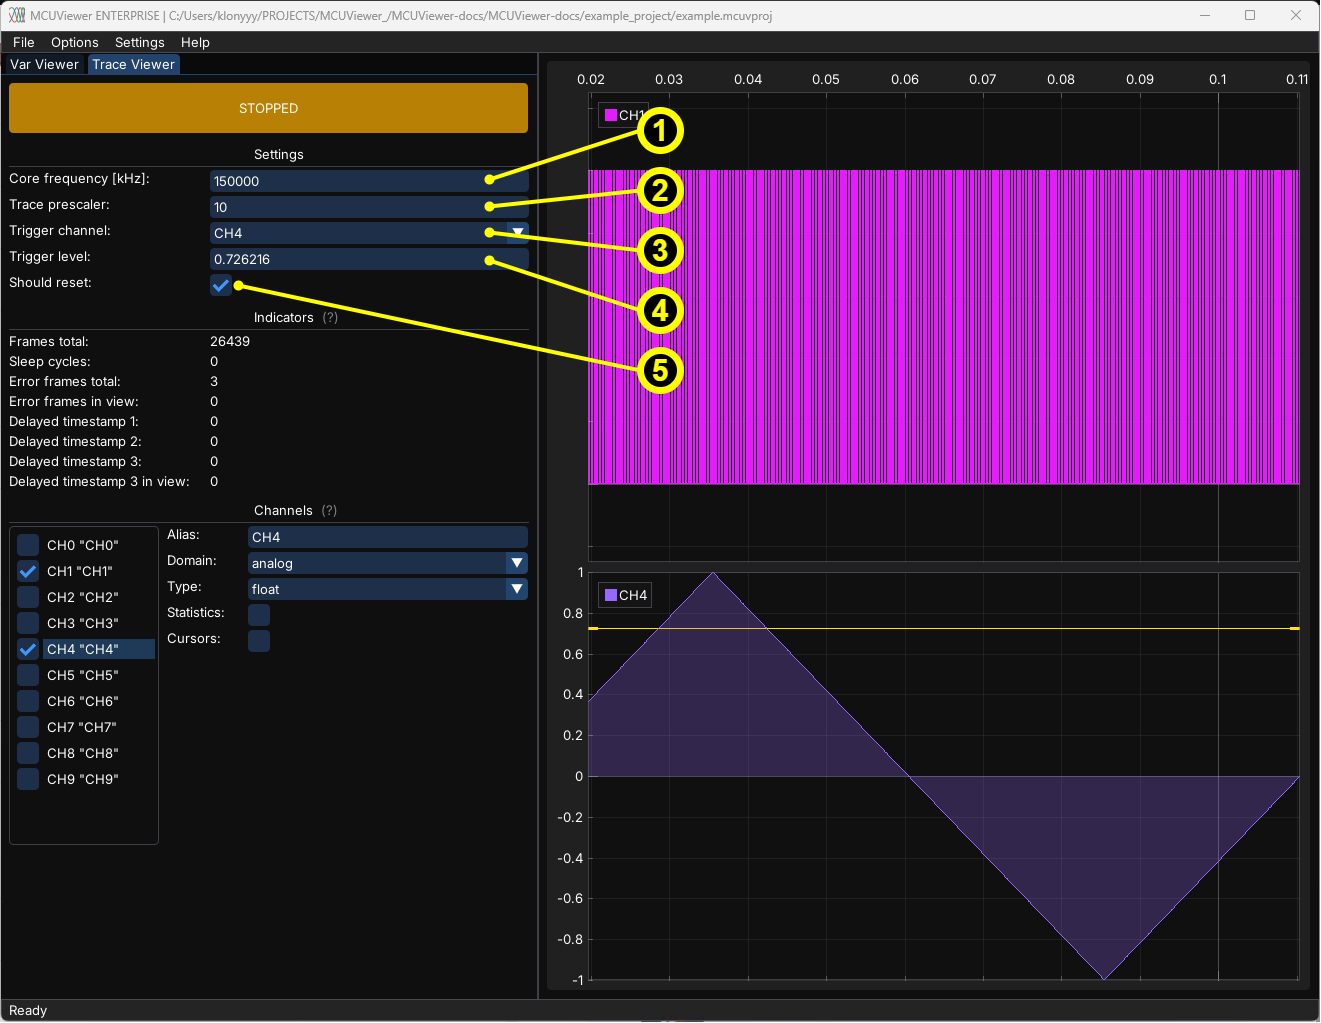
The control panel includes the main button and a few quick-access settings:
Core frequency- frequency of the target core in kHz.Trace prescaler- controls the trace sampling rate. This setting directly affects data rate - the lower you go the more channels you can sample, however the debug probe SWO speed might be a limiting factor. Please make sure the calculated speed is within your SWD speed limits.Trigger channel- select the channel that will be used as a trigger signal.Trigger level- level of the trigger - when the signal goes above it the buffer will be collected and acquisition will be stopped automatically.Should reset- check if the target should be reset before starting the trace.
Note
Currently the trace trigger operation is limited to basic functionality. If more advanced trigger control is needed please refer to Recorder.
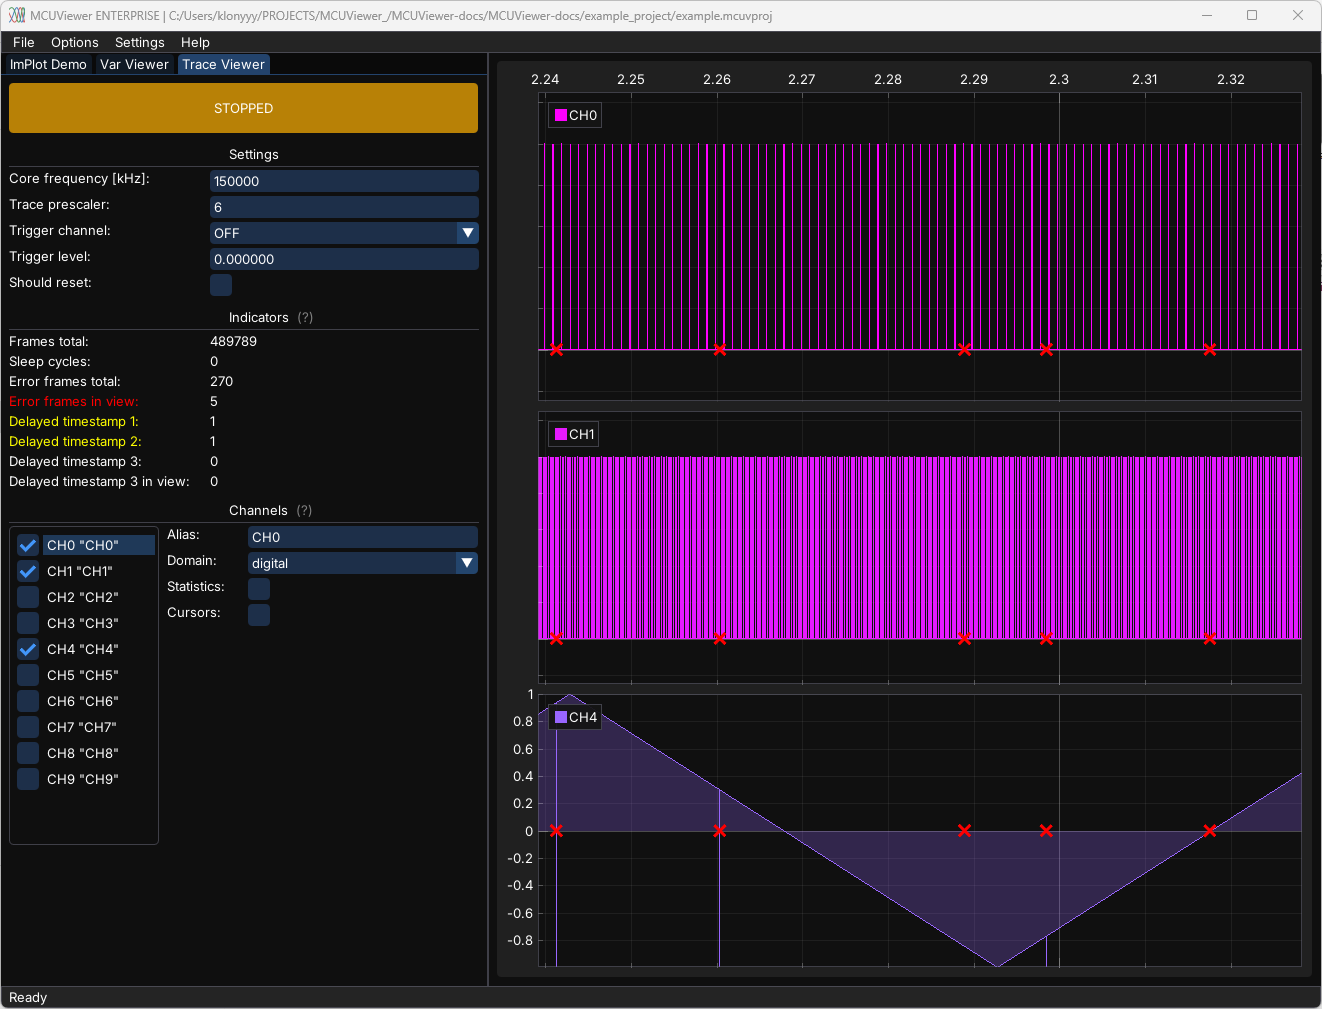
Indicators#
Indicators show the status of the trace and any errors that might have occurred. If the Core frequency or Trace prescaler are incorrect, or there is too much data on the SWO line, the trace peripheral will indicate delayed frames or error frames. Having multiple error frames, delayed 2, or delayed 3 frames may indicate that the trace bandwidth is not sufficient for the data being pushed. These frames are depicted with red (error frames) or yellow (delayed frames 2/3) crosses on the plot, and the data around them should be ignored.
Channels list and settings#
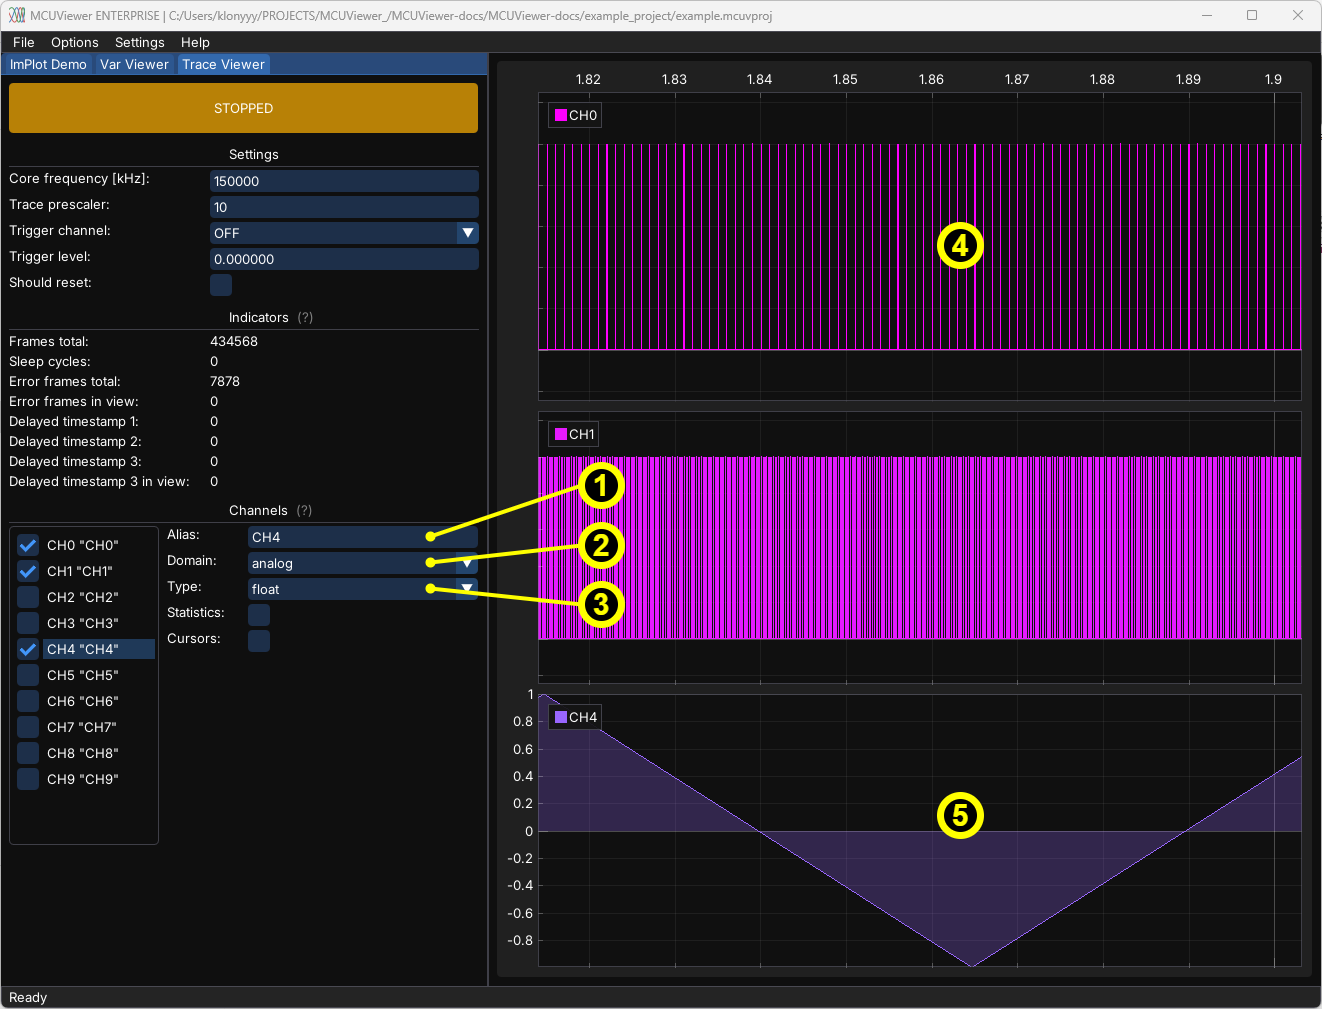
The channels list allows you to select channels and access their quick settings. A tick next to the channel name indicates that the channel is being used.
Alias– name of the channel (can be different from the channel number).Domain– domain of the channel. Can beanalogordigital. Digital channels represent only binary data. Analog channels can represent all supported types.Type– type ofanalogchannel if used; depends on which variable you log in your code.Example of a digital channel.
Example of an analog channel.
Channels canvas#
Channels canvas is where all plots are drawn. The same plot manipulation rules apply as in {ref}”VariableViewer”, with the exception that there is only one plot type - curve.
Setup#
First make sure that the SWO of your microcontroller is connected to the debug probe and that the GPIO pin of the SWO is correctly configured.
In order to set up the trace viewer you need to place special “markers” in your code. These markers are simple register writes to the ITM (Instrumentation Trace Macrocell) peripheral. The values that have to be written differ based on plot you’d like to represent.
Digital plots#
Measure execution time of foo():
ITM->PORT[x].u8 = 0xaa; //enter tag 0xaa - plot state high
foo();
ITM->PORT[x].u8 = 0xbb; //exit tag 0xbb - plot state low
where x is the channel number in MCUViewer.
Analog plots#
Displaying value of a variable as a function of time:
float a = sin(10.0f * i);          // some high frequency signal to trace
ITM->PORT[x].u32 = *(uint32_t*)&a; // type-punn to desired size: sizeof(float) = sizeof(uint32_t)
or
uint16_t a = getAdcSample();       // some high frequency signal to trace
ITM->PORT[x].u16 = a;
where x is the channel number in MCUViewer.
In case of analog plots it is necessary to change the plot type to analog and pick the desired variable type in MCUViewer.
Note
During initial setup it is advised to try a digital plot on channel zero to make the setup as simple as possible
After downloading the modified firmware, please select the debug probe in the TraceViewer tab under the Options->Acquisition window. Close the window, then set the core frequency and trace prescaler. Start with a high prescaler value of around 20, as it largely depends on your debug probe and SWD setup. Select only a single channel-for example, channel 0-and press the start button.
In case of any errors please see the FAQ.