Variable Viewer#
The Variable Viewer module allows you to visualize the values of variables in real time. It uses the debug probe to sample memory at addresses read from the *.elf file of your project. It is quick to set up and provides an almost non-intrusive way of accessing MCU data. The Variable Viewer module allows you to both read and write variable values in real time.
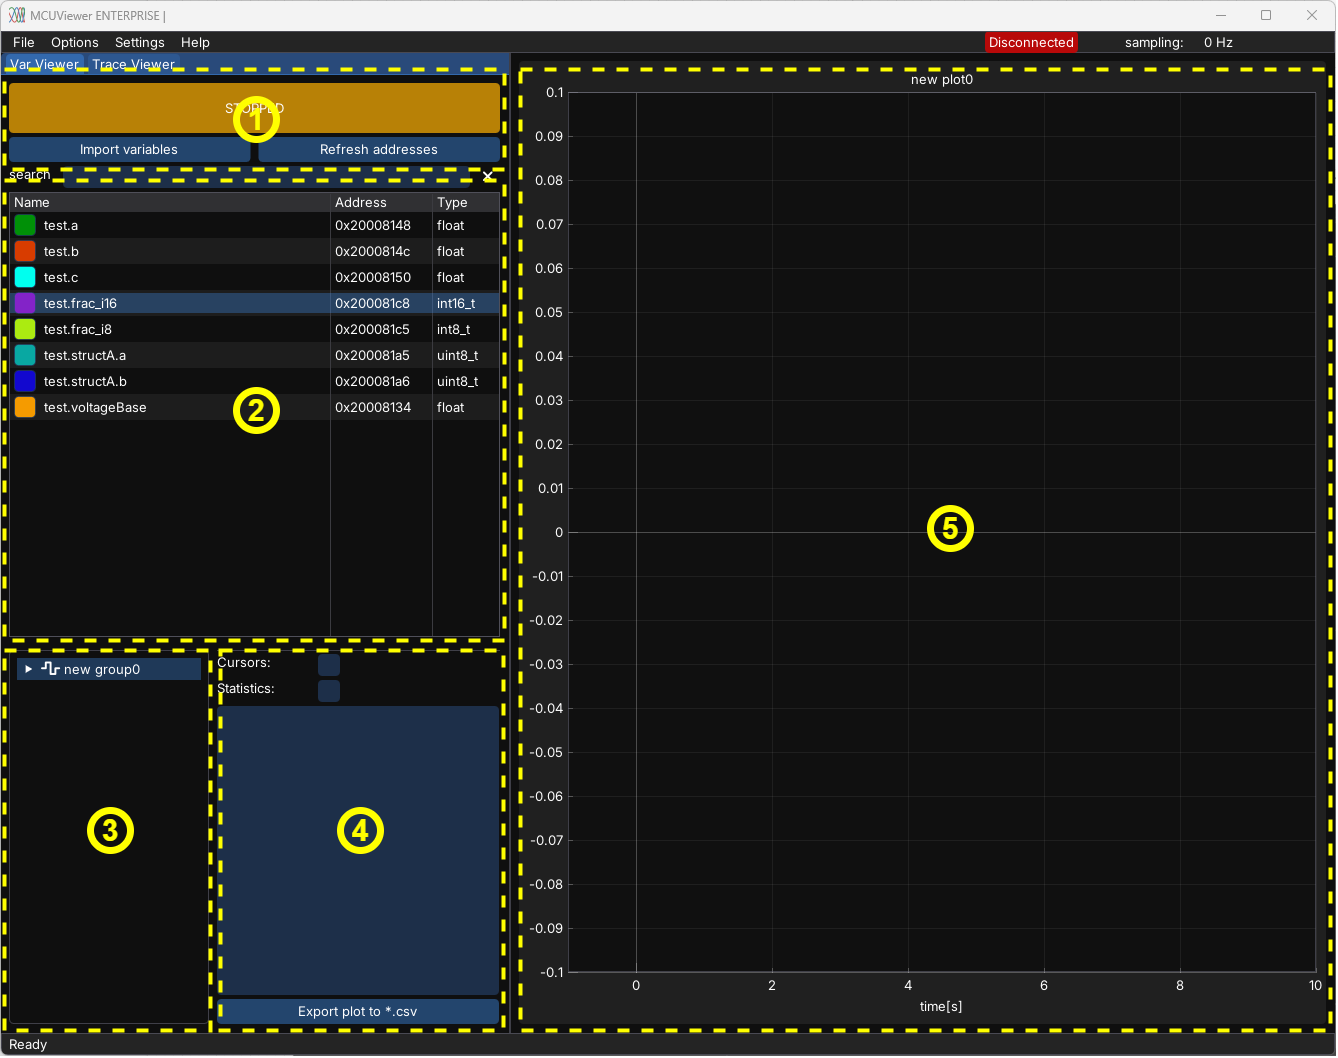
Variable Viewer window consists of five main parts:
Control panel - main control panel
Variable table - imported variables will show up here
Plot group tree - list of all groups and plots
Plot settings - settings for currently selected plot
Plot canvas - plots are drawn here
Control panel#
There are three main buttons in the control panel:
START/STOP button – used to start/stop data acquisition. When an error occurs, the button will turn red and display the error message when hovered over.
Import Variables button – used to import variables from your project and add them to the variable table.
Refresh Addresses button – used to refresh the addresses of imported variables in case the automatic refresh did not succeed.
Note
When Refresh on *.elf change in Acquisition Settings window is checked the refresh button will be automatically pressed when the *.elf file is changed.
Variable table#
The variable table holds all the variables.
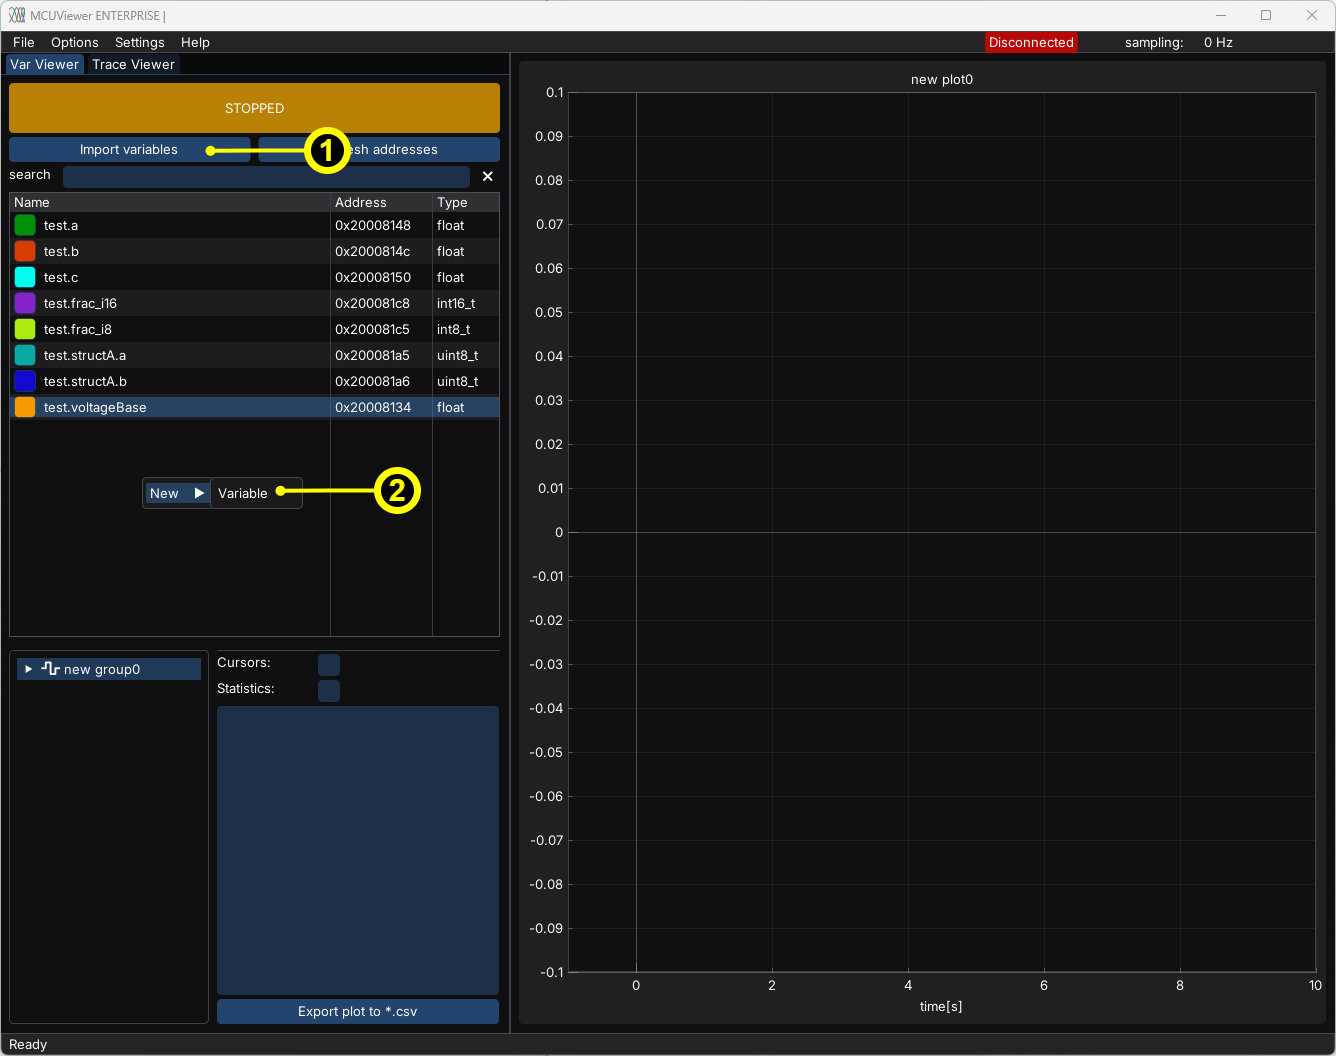
There are two ways to add variables to the table:
Click the
Import Variablesbutton and select the variables from your project.Right-click in the variable table area and select
New -> Variable. Set the name manually and close the window. This option can be used if your variable is not listed in the import dialog.
You can see each variable’s settings by double clicking it or by right clicking and selecting Properties.
Generally, the default settings are sufficient. However, there are cases when modifications are necessary.
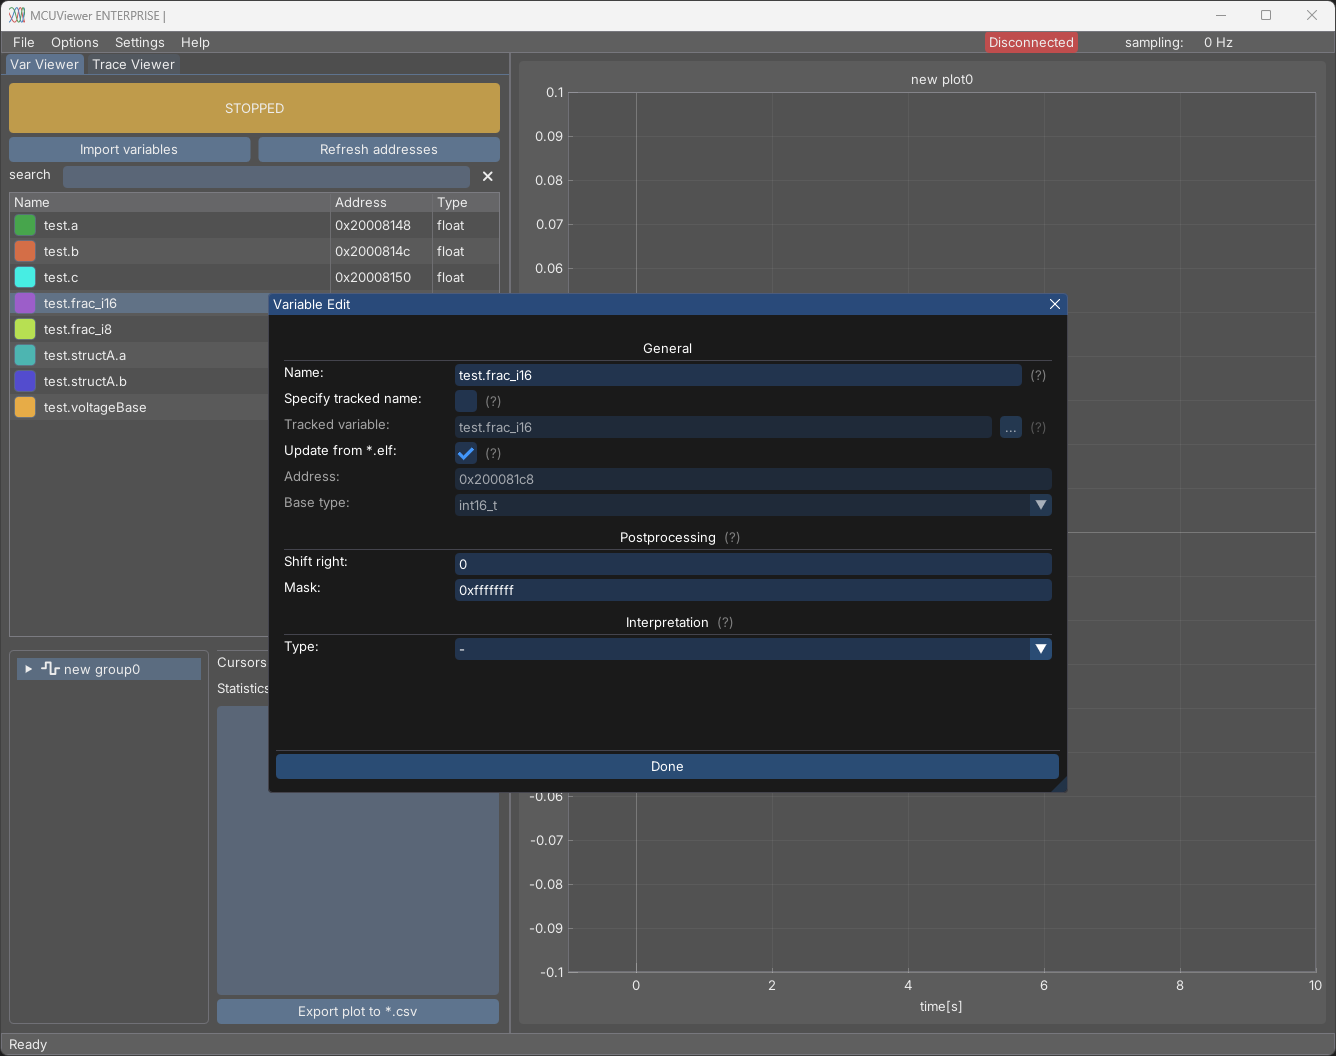
General section - manual variable import#
Sometimes, the import window may not detect variables with more complex types. In such cases, you can use the New -> Variable option to add the variable manually. Then, by changing the Name field, the variable should be detected correctly when the window is closed or when the Refresh Addresses button is clicked.
General section - custom address#
In some cases, it may be necessary to read a predefined address, for example, in the register area. This can be done by creating a new variable and unchecking the Update from *.elf checkbox. Then, the address and type can be set manually. Later on, to extract certain bits, the Postprocessing section can be used.
Postprocessing section - error bits#
The Postprocessing tab can be used to extract specific bits from a variable. This is useful, for example, when reading error flags.
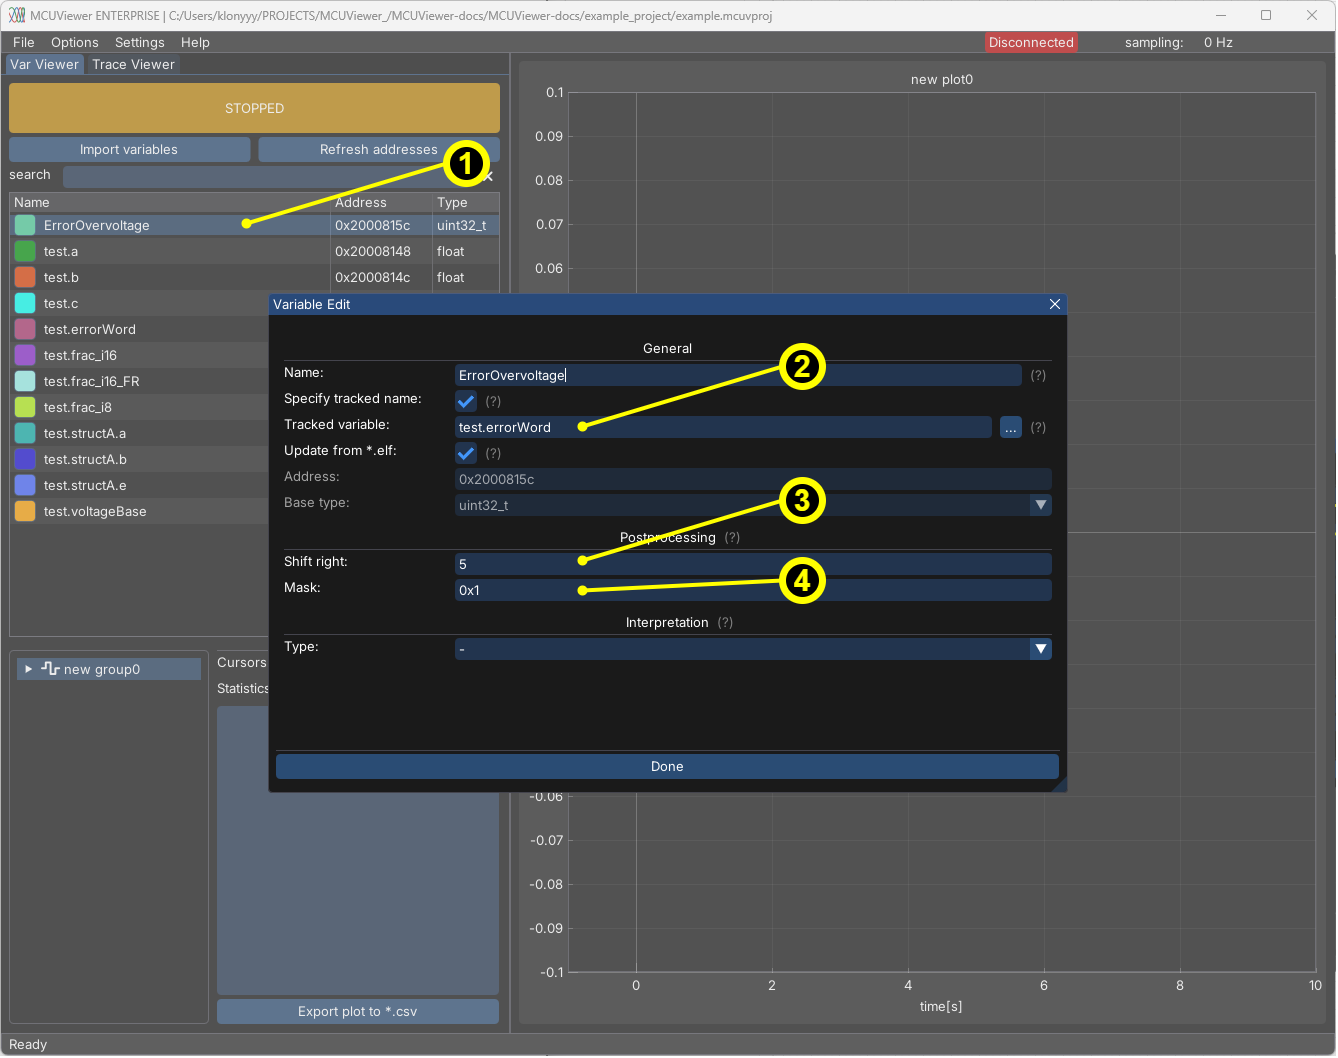
Add a new variable (right-click ->
New -> Variable).Select the
Specify tracked namesetting and choose the error word variable.In the
Postprocessingtab, select the number of right shifts (position of the bit).Set the mask to
0x1to select only the least significant bit.
After that, the variable should be set to one when the bit is set and zero when it’s cleared.
Interpretation section - fixed point variables#
MCUViewer is able to interpret fixed-point variables. To do so, make sure the original variable is imported. You can either copy the original and modify the copy, or modify the original directly.
Note
Right now, interpreted variables cannot be easily distinguished from the original variables. This is why it’s recommended to copy the original variable and add a postfix to the copied variable name, e.g., “_FR” to indicate a fractional variable.
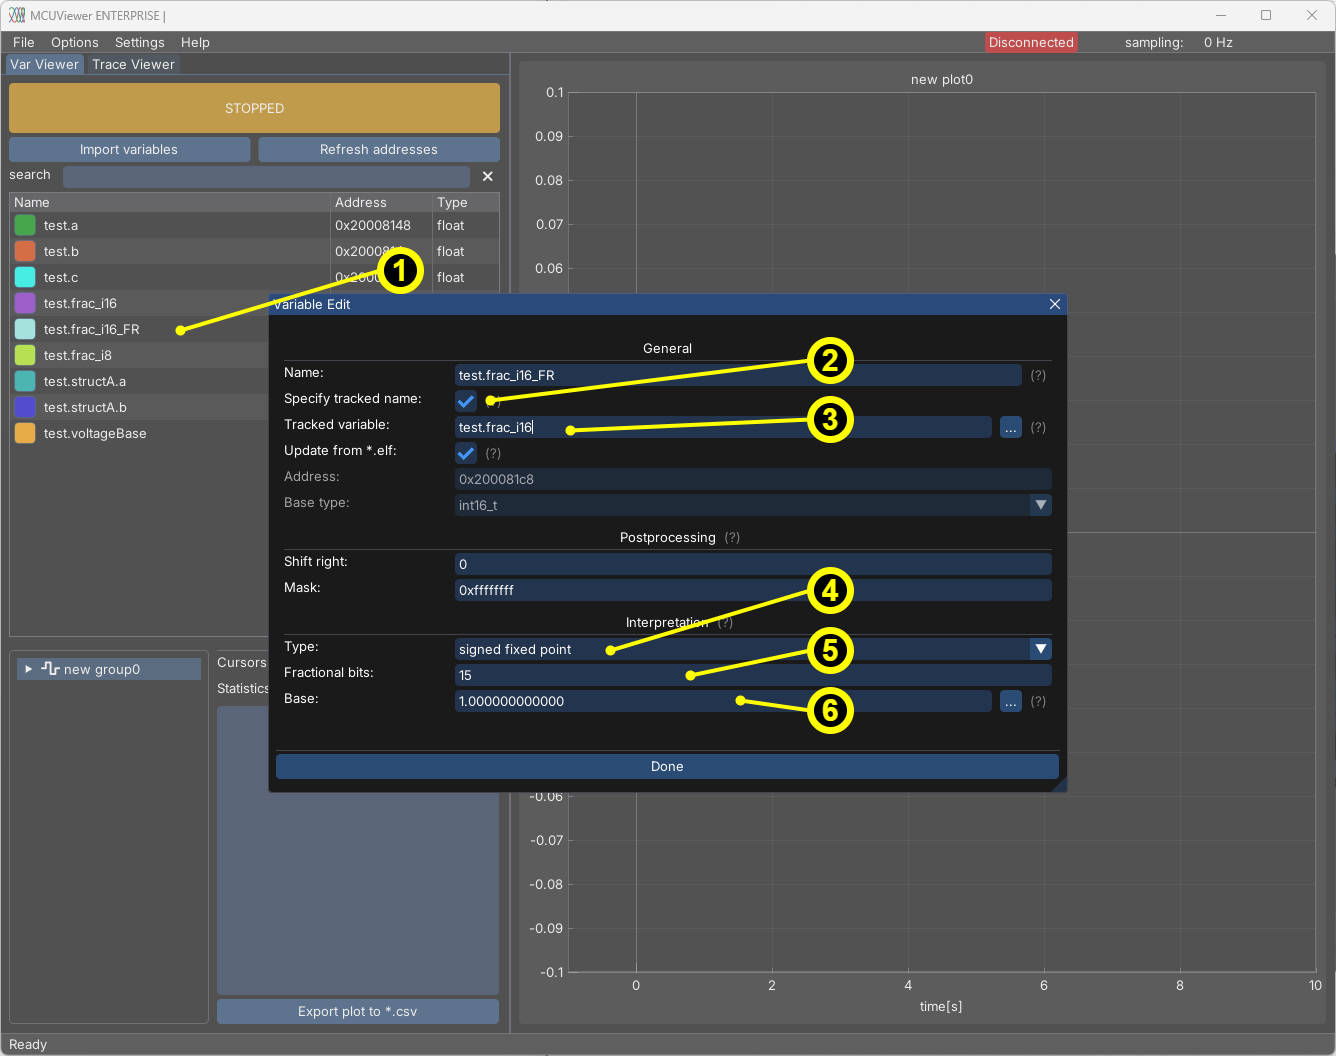
Copy the original variable (right-click ->
Copy). Add “_FR” to the copied variable name.Select the
Specify tracked namesetting.Select the original variable in the
Tracked namefield.Select the fixed-point interpretation option (signed or unsigned).
Set the number of fractional bits (depends on the detected type).
Either type a numeric base (scaling factor) or select a variable that holds it. This is useful when you’d like to represent physical values in the plot.
Plot group tree#
The plot group tree holds all groups and plots. Each group can contain multiple plots. There are two types of groups:
Sampling group – Plots in this group are sampled at the frequency set in the Acquisition window. This allows for recording longer time series. However, it is not recommended for high-speed signals, as they may become distorted due to the lack of synchronization between the sampling frequency and the signal frequency.
Recorder group – Curve plots in this group are displayed from the recorder’s buffer. The recorder allows high-frequency data to be displayed without distortion. Please see Recorder for more details.
To add a new group simply right click in the plot group tree area and select New -> Sampling group or New -> Recorder group.
Note
The recorder group can only be added if the recorder module is detected. Please see Recorder for more details.
To add a plot to a group right click on a group and select New -> Plot.
Plot settings can be accessed by double-clicking its name or by right-clicking and selecting Properties.
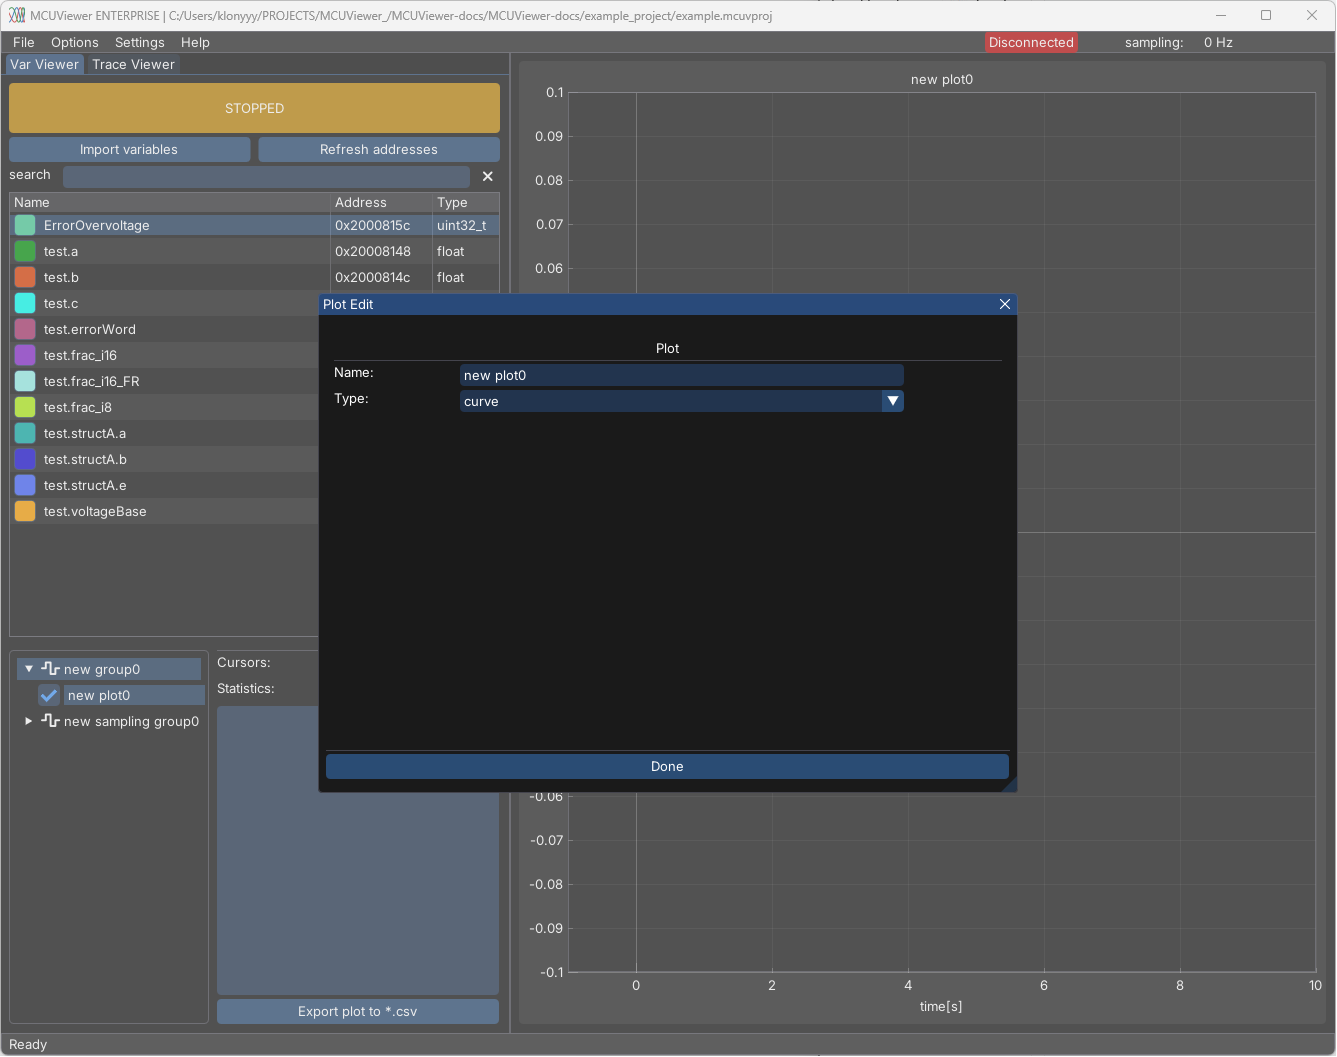
By default, the plot is of type Curve; however, there are four types available:
Curve - regular time based plot.
Bar - bar plot.
Table - table plot, also used to write values.
XY - Curve plot with selectable X and Y axes.
When new plots are added they are empty. One can drag and drop the variables from variable table to add them to the plot area.
Plot settings#
The plot settings window is a sub-window that provides quick-access settings for the currently selected plot. Its appearance may vary depending on the group type (Recorder or Sampling). This window allows you to enable cursors, open the statistics window, and manage the plot’s variable list.
Cursors#
Cursors allow to measure signal properties like on an oscilloscope.
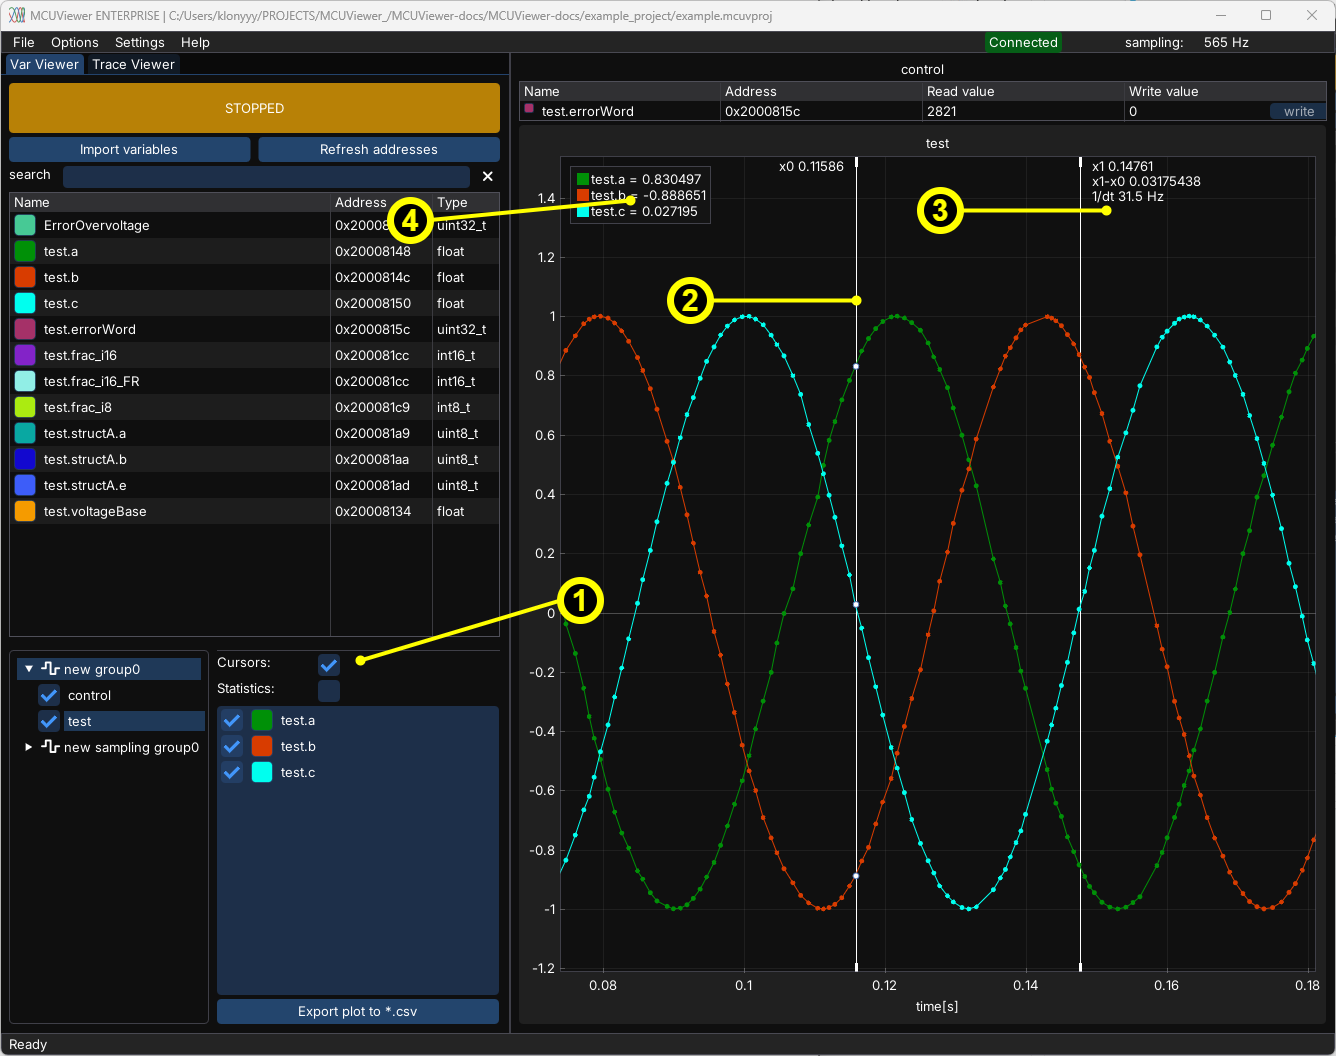
Turn on cursors.
Drag the X0 or X1 cursor.
The results are shown close to the X1 cursor.
The values ov variables are displayed in the legend. These are the Y-axis values at X0 cursor position.
Statistics window#
Statistics window allows to display statistics for the currently selected plot.
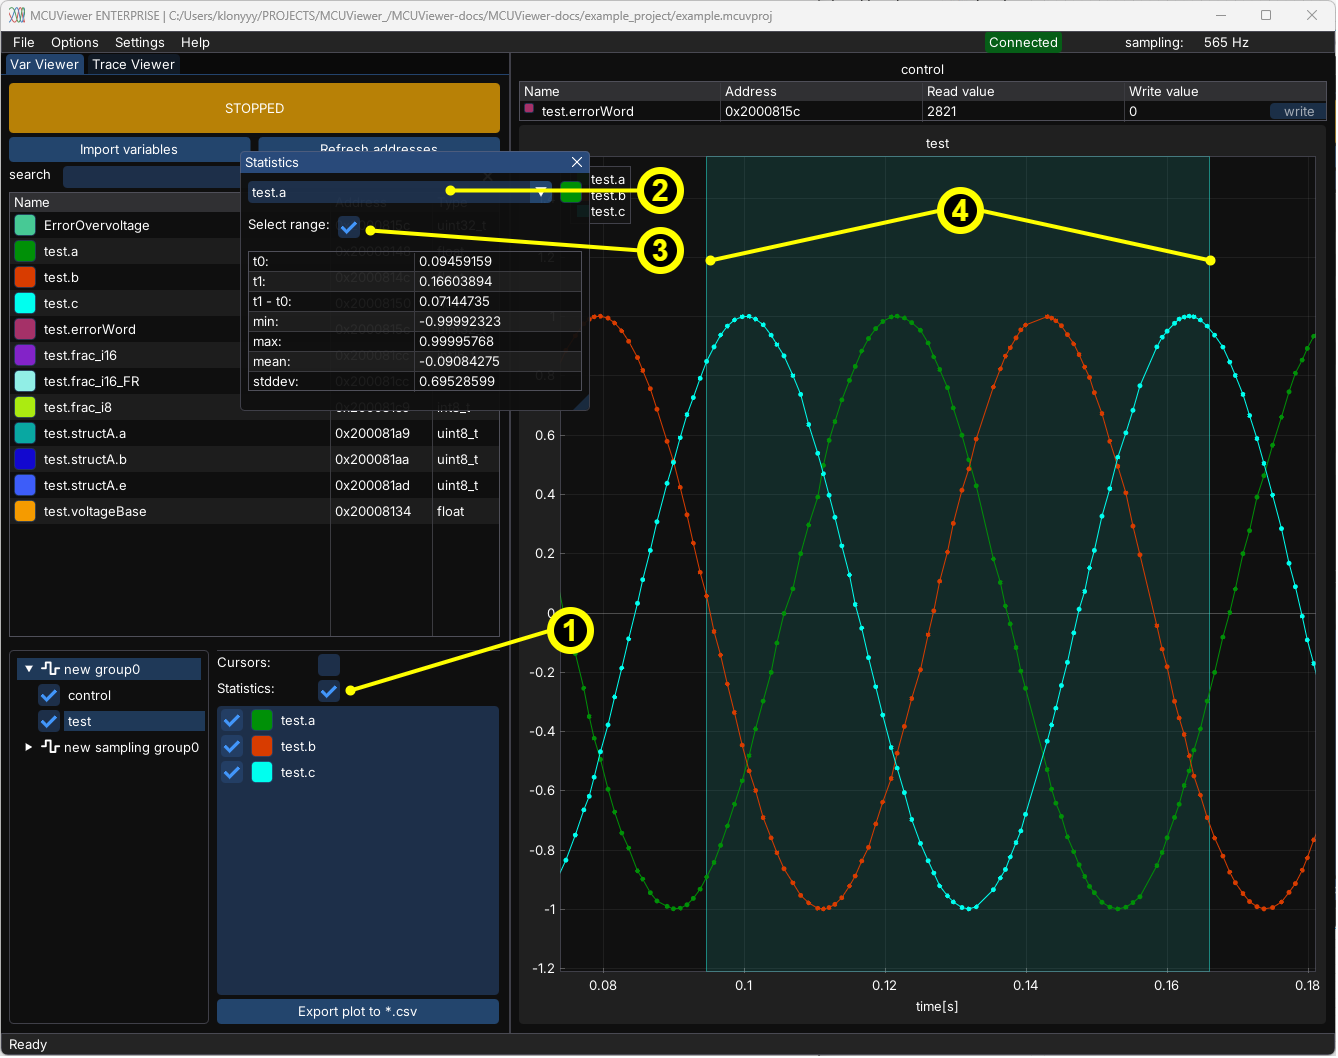
Turn on statistics window.
Select the series to be analyzed.
Select range to pick a subset of data.
Drag the ends of the range to modify it.
Plot variable list#
Plot variable list allows to add/remove variables from the plot. Right click to remove a variable from the plot. Check/uncheck to include/exclude the variable from the plot.
Note
Ticking the checkbox next to a variable will remove it from the sampling list only after restart. During acquisition it can be used to hide a particular series.
Export to *.csv#
Click to export to *.csv - the data is exported as a table of all series from the selected plot.
Plot canvas#
Plot canvas is where all plots are drawn.
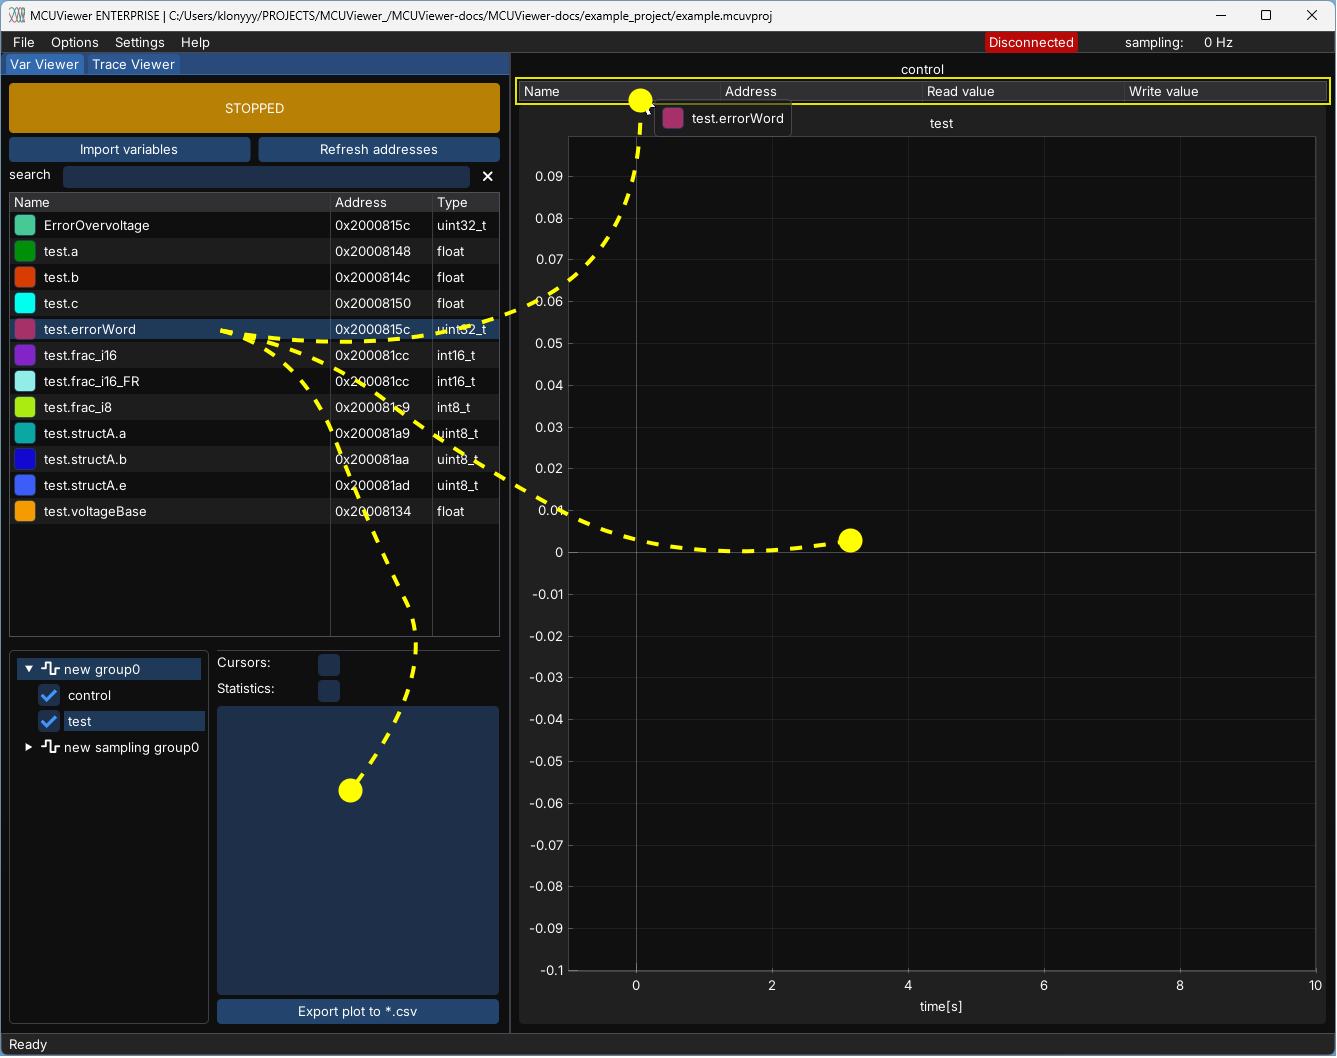
Table plot#
Table plot type can be used to read (1) and write (2) a variable value. Right clicking on the read field (1) allows to change the display format to hexadecimal, or binary.
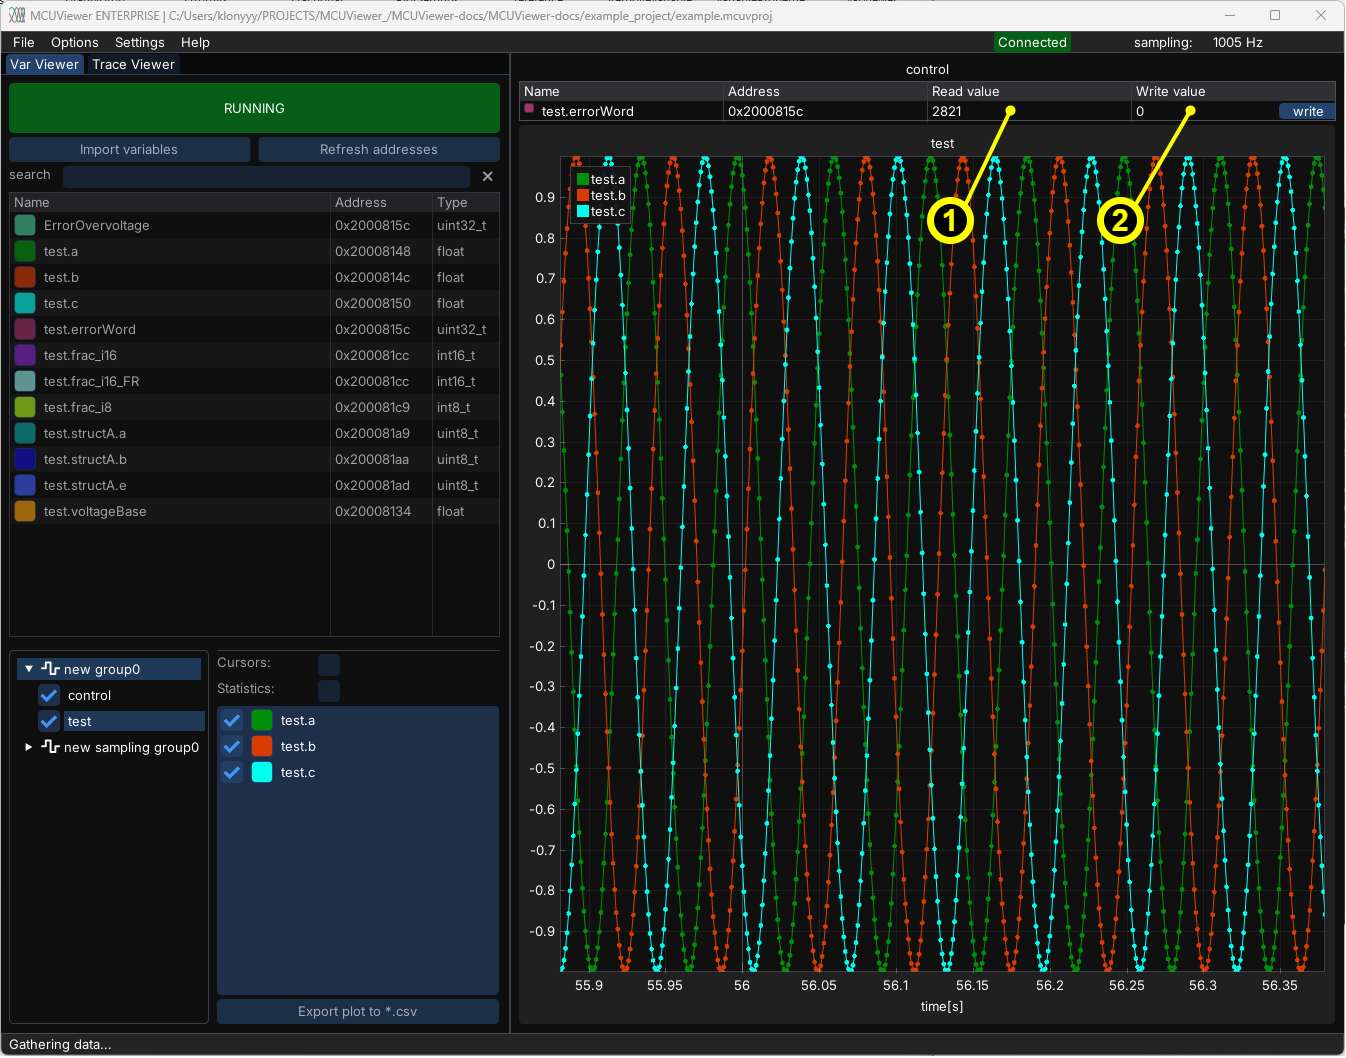
Note
New variable value can be written when the write field is focused and enter key is pressed, or when the write button is clicked. When the field looses focus it will not be written.
Curve plot#
Curve plot manipulation is done using mouse - drag to pan, scroll to zoom, right click to open context menu. Right click and drag allows to select a zoom window. Double left click adjusts the scale to fit the data.
Warning
Zooming and dragging is not possible during the acquisition.