Introduction
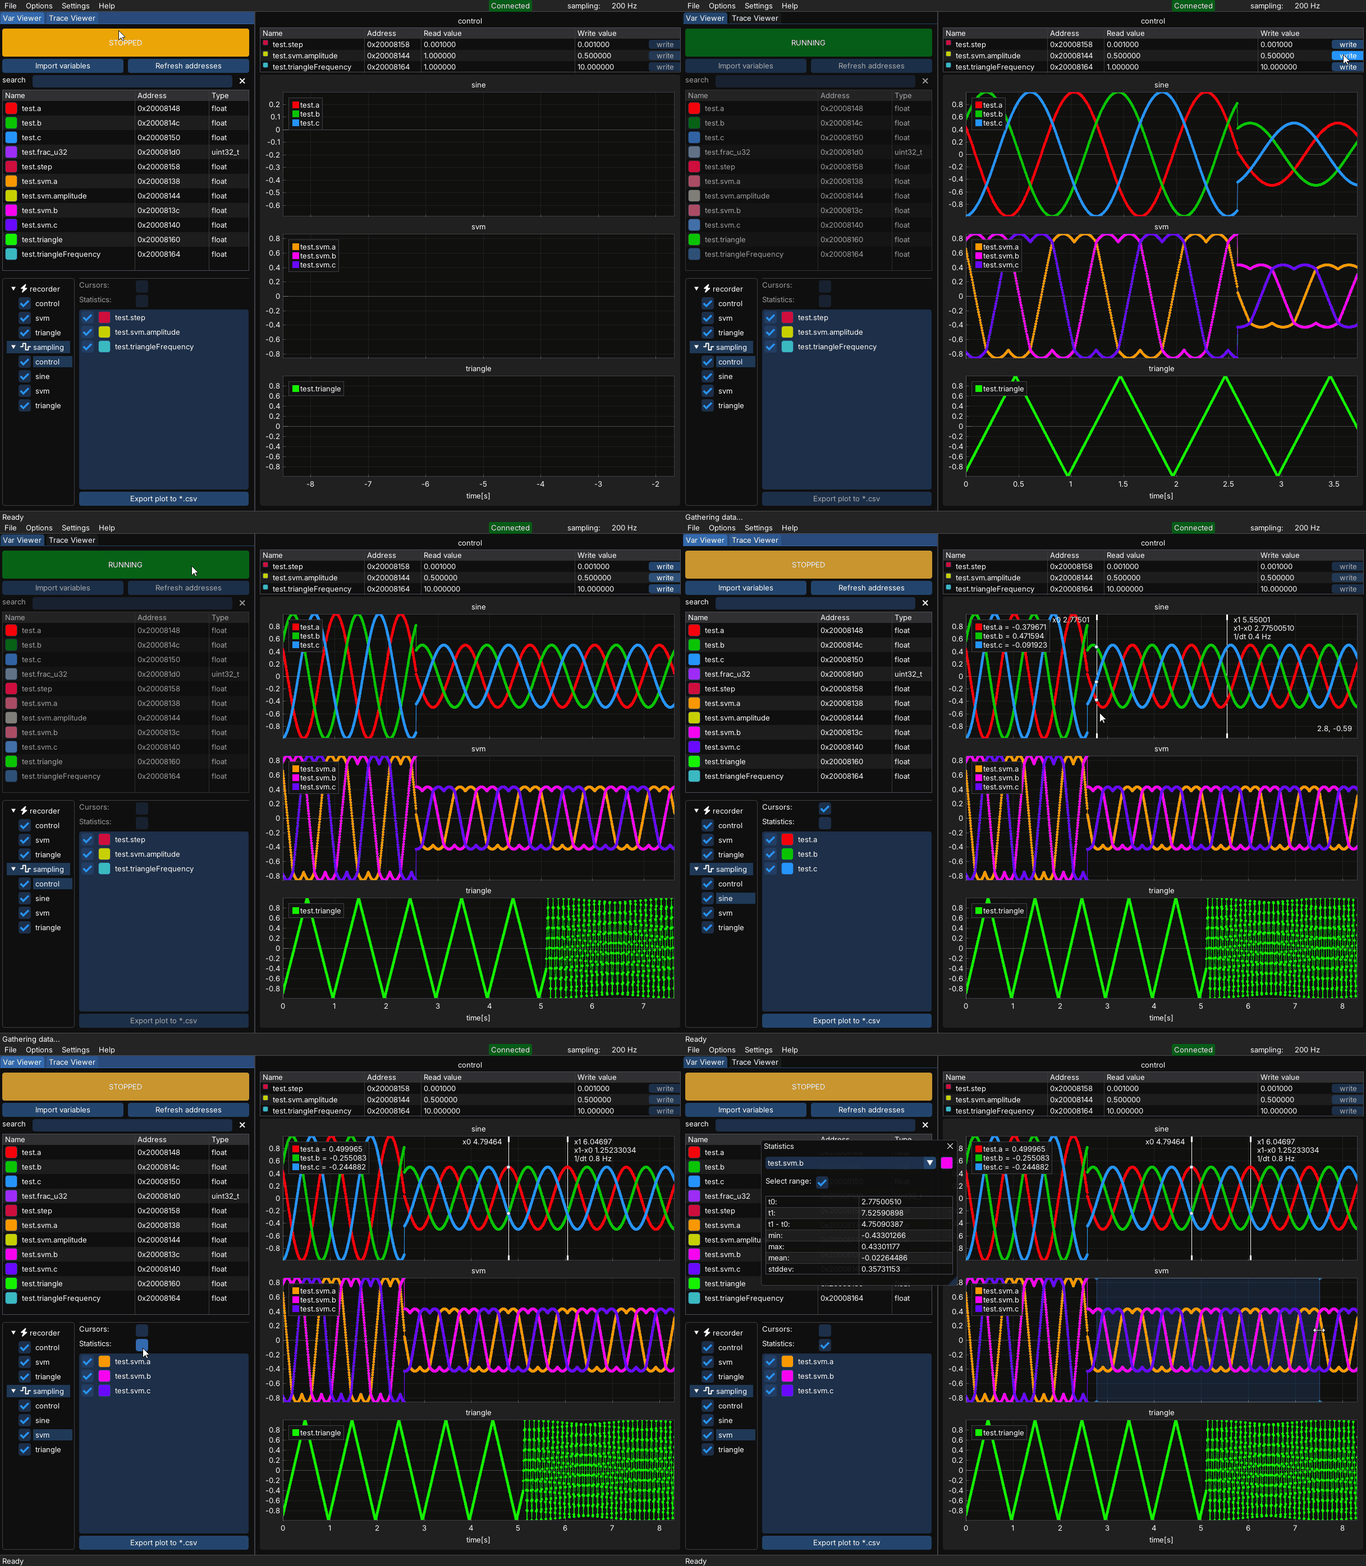
MCUViewer is a non-intrusive GUI debugging tool for microcontrollers that allows quick visualization of variable values in real-time. It works with STM32, RP2040 and other Arm Cortex-M microcontrollers through ST-Link, J-Link or OpenOCD-compatible probes, and with practically any MCU - for example TI C2000 - over a serial port. Besides plotting variables in the Variable Viewer, it can display high-frequency SWO data in the Trace Viewer and capture very fast signals with the Recorder.
Downloads
MCUViewer can be downloaded from the MCUViewer website.
Supported Probes and MCUs
MCUViewer natively supports the following interfaces:
ST-Link
J-Link
OpenOCD-compatible probes (via GDB server; not all are fully tested)
If your probe is not natively supported by MCUViewer (for example, TI C2000 probes), you can use the Serial Driver solution instead. This allows MCUViewer to communicate with any target device that provides a serial interface, making it a universal fallback option.
Installation
Windows
On Windows MCUViewer can be either installed or unpacked (portable version). Unpacking might be preferable in some cases as it does not require admin rights.
Installing - download the *.zip file, unpack it, and double click the installer. Follow the instructions.
Unpacking - download the *.zip file, unpack it, and unpack the *.exe installer once again. Copy the unpacked folders to a preferred location. Run by double clicking the
MCUViewer.exefile from bin directory.
Linux
MCUViewer for Linux is available as a *.deb package and as an AppImage.
*.deb package - download it and install using:
sudo apt install ./MCUViewer-x.y.z-Linux.debAppImage - a single file that runs without installation on most distributions. Download it, make it executable and run it:
chmod +x MCUViewer-x.y.z-x86_64.AppImage && ./MCUViewer-x.y.z-x86_64.AppImage
The default *.elf parser uses the system gdb. The *.deb package installs it as a dependency - when using the AppImage please make sure it’s present by typing gdb --version in your terminal window, or switch to the built-in DWARF parser (see Acquisition Settings).
MacOS
Download the *.dmg package matching your Mac - Apple Silicon (ARM) or Intel (x86). Open it and drag and drop the MCUViewer app to Applications folder. If the application does not run due to unverified source, make sure to allow it in the security preferences (Privacy & Security -> Security -> “Open Anyway”).
Project files
MCUViewer projects are saved as .mcuv files (File -> Save / Save As..., or automatically - see General Settings). Projects created with MCUViewer 1.2.x (.mcuvproj) can be opened directly - they are converted and saved as a *.mcuv file next to the original, which stays untouched.
Quick Start - Variable Viewer
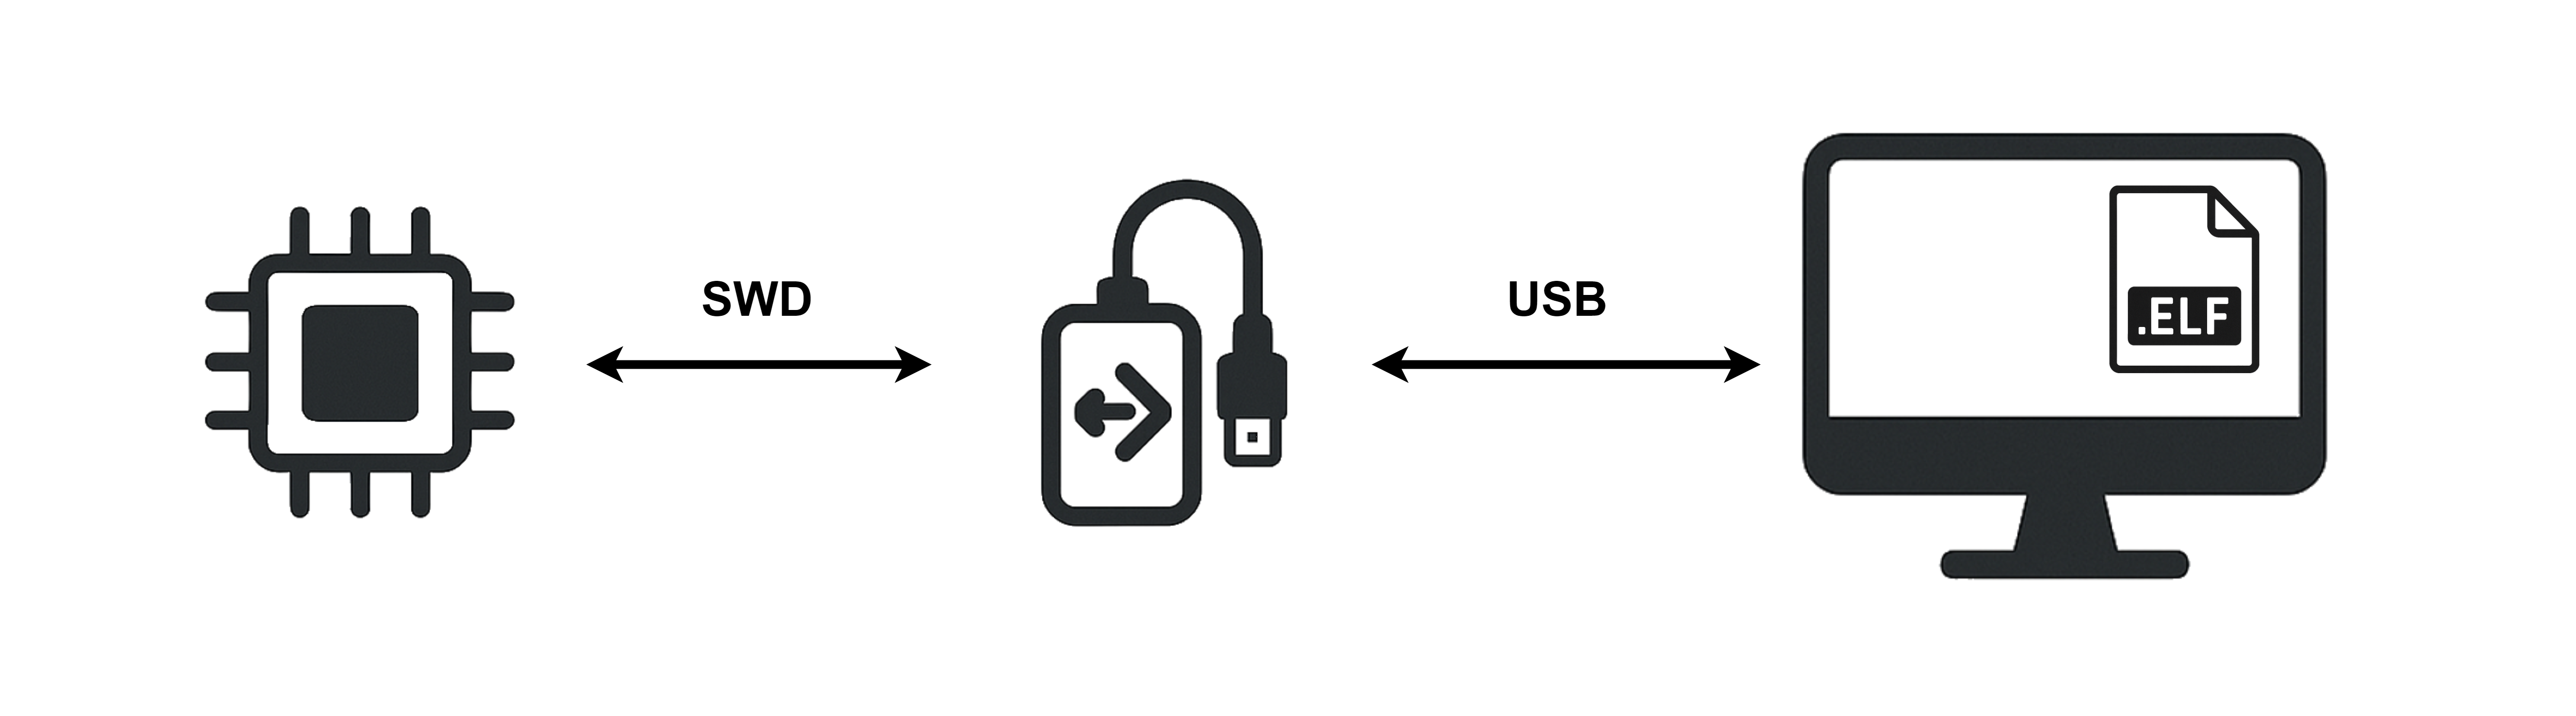
The Variable Viewer module samples the addresses of selected variables at regular time intervals. It is generally well-suited for medium-frequency signals, as the sampling rate is limited by the SWD speed and the type of probe used. If high-speed readout is required, please refer to the Recorder section or try the SWO-based Trace Viewer.
Your target should be connected to the debug probe using SWDIO, SWCLK, and GND pins.
Select the
*.elffile of your project inOptions->Acquisition.Choose the debug probe.
Close the
Options->Acquisitionwindow and click theImport variablesbutton.Select the variables you want to visualize and click
Import.Drag and drop the selected variables onto a plot.
Click the large
STOPPEDbutton (or pressSpace) to start data acquisition.
In case of any errors make sure to visit Variable Viewer and FAQ
Quick Start - Trace Viewer
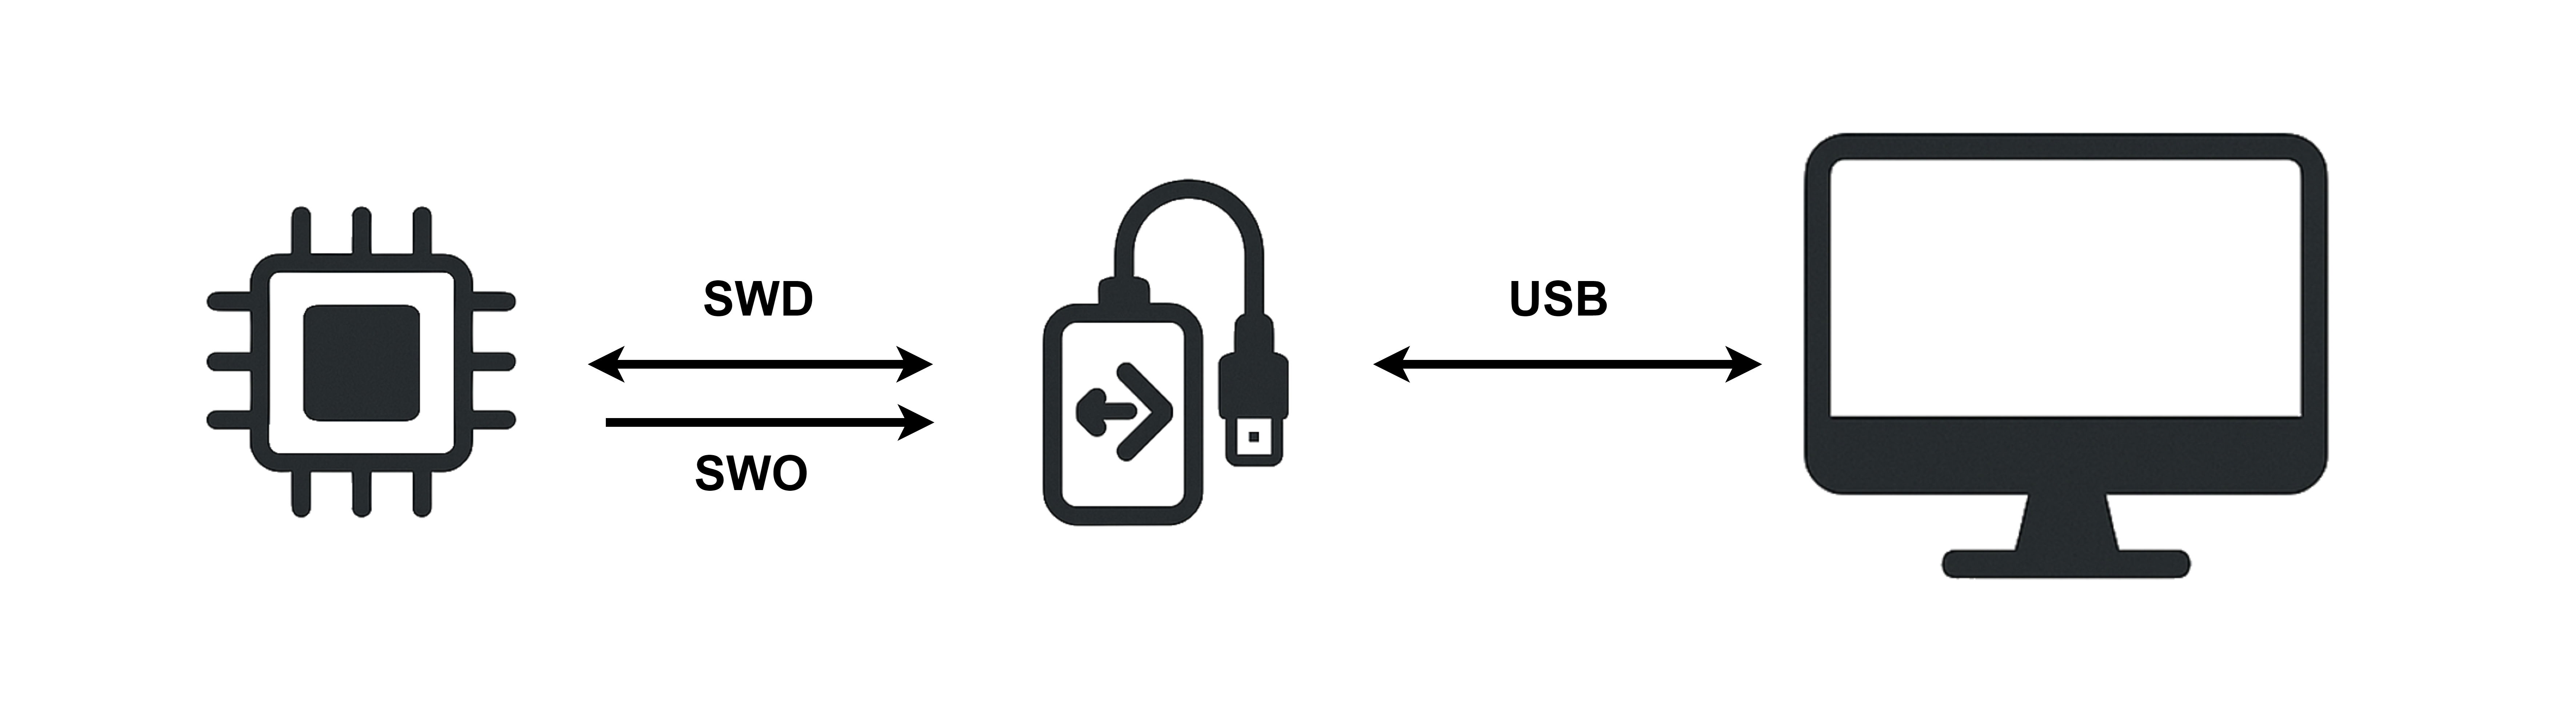
The Trace Viewer module parses SWO trace data and displays the results in the form of plots. It enables visualization of high-speed signals with minimal overhead, as well as digital plots for visualizing and profiling interrupt execution.
Your target should be connected to the debug probe using the SWDIO, SWCLK, SWO, and GND pins.
Switch to the
Trace Viewertab.Select the trace probe in
Options → Acquisition, then close the window.Enter your core frequency in kHz in the main window.
Select a trace prescaler - start with a relatively high value (e.g., ~20), as this depends heavily on your debug probe and SWD setup. The resulting SWO clock is shown below the prescaler.
In your code, place special markers:
Example for digital data:
ITM->PORT[x].u8 = 0xaa; //enter tag 0xaa - plot state high
foo();
ITM->PORT[x].u8 = 0xbb; //exit tag 0xbb - plot state low
And for tracing “analog” signals you can use:
float a = sin(10.0f * i);          // some high frequency signal to trace
ITM->PORT[x].u32 = *(uint32_t*)&a; // type-pun to the desired size: sizeof(float) = sizeof(uint32_t)
or
uint16_t a = getAdcSample();       // some high frequency signal to trace
ITM->PORT[x].u16 = a;
where x is the channel number in MCUViewer. Moreover you need to configure the SWO pin of your microcontroller.
Click the large
STOPPEDbutton to begin acquisition
In case of any errors please visit Trace Viewer and FAQ
License
MCUViewer is distributed under the EULA License. The license is available online and after installation in:
Windows:
C:\Program Files\MCUViewer\binLinux:
/usr/local/MCUViewerMacOS:
Applications/MCUViewer.app/Contents/Resources
For questions regarding licensing, contact contact@mcuviewer
Reporting bugs or improvements
To report an issue or a feature request please contact us at contact@mcuviewer
In case of a bug, please provide the following information to make it easier to reproduce and fix:
MCUViewer version
Operating system and version
Debug probe and target type
Log file (log directory can be found in
Settings->Generalwindow)Steps to reproduce, screenshots or videos of the issue
If MCUViewer crashes, it offers to send a crash report the next time it is started. The report contains the crash details, the MCUViewer version, your OS version and an anonymous device id - sending it helps us fix the issue faster.