Recorder
The recorder module allows visualization of very high-speed signals, even on low-cost targets or when SWD communication speed is limited due to galvanic isolators or long cables. It is more intrusive than using a sampling group, as it must be compiled into your project-although the runtime penalty is usually minimal.
Recorder setup
Copy the recorder folder from the downloaded MCUViewer *.zip file to your project. The recorder module on the target side consists of three files:
recorder.crecorder.hrecorderDefines.h
Add the recorder folder to the build system.
Modify the recorderDefines.h file to match your system configuration.
Call recorderStep() function at the end of your high-frequency interrupt. Make sure the recorderStep() function cannot be preempted by other interrupts.
Compile the project and add select the *.elf file in the Options->Acquisition window.
Select the debug probe.
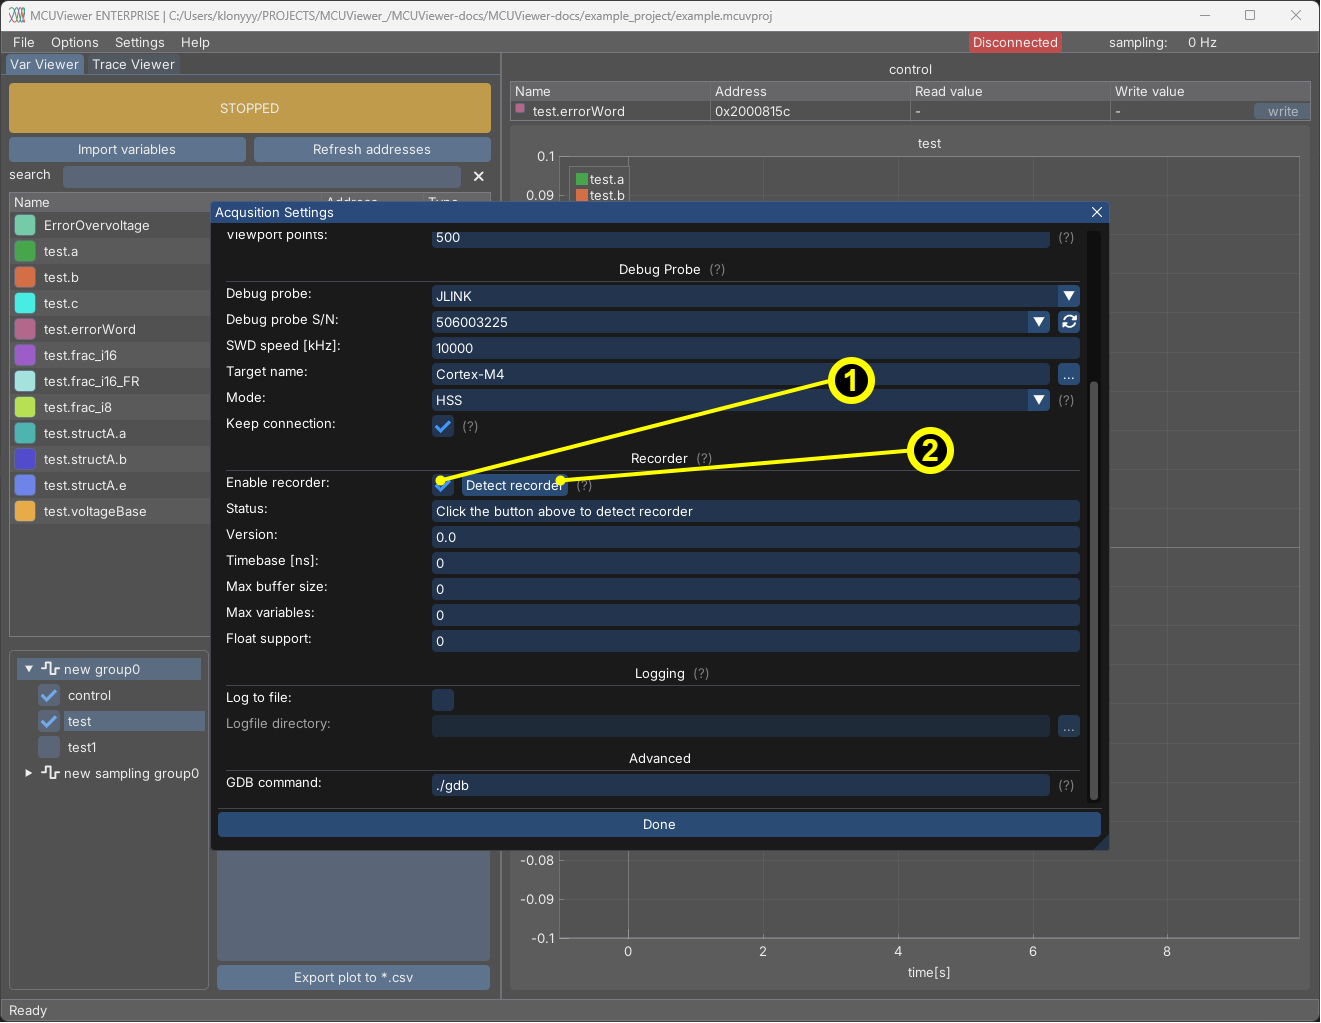
Enable the recorder module by ticking the “Recorder” checkbox (1) in the Options->Acquisition window.
Click the
Detect recorderbutton (2). If it is detected correctly there should be no errors, just aRecorder detected!information with all fields filled in as in therecorderDefines.hfile.
In case of errors please first see the FAQ section and Examples section.
Recorder usage
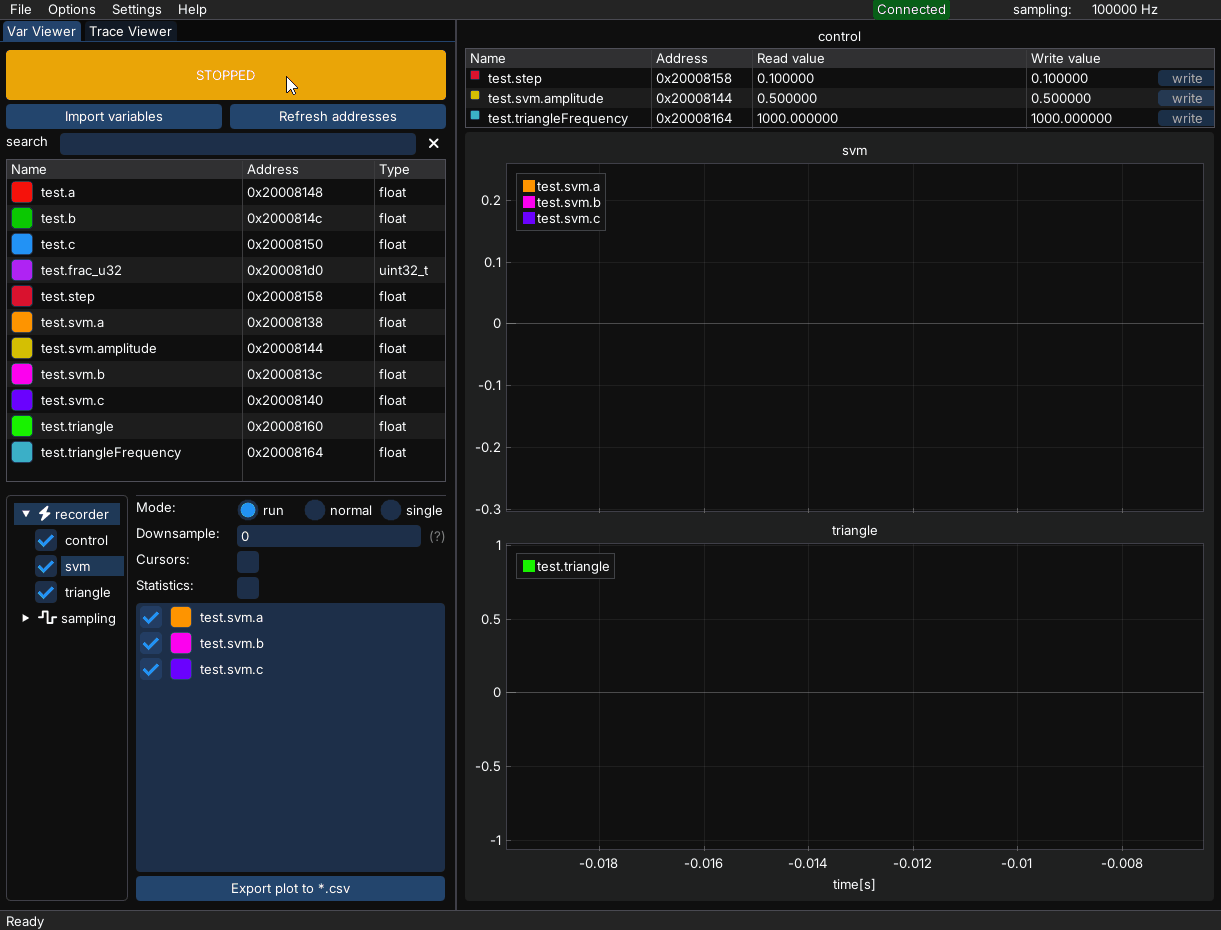
After successful setup it is now possible to add a new recorder group. Proceed to the Plot group tree section, right click and select New->Recorder group.
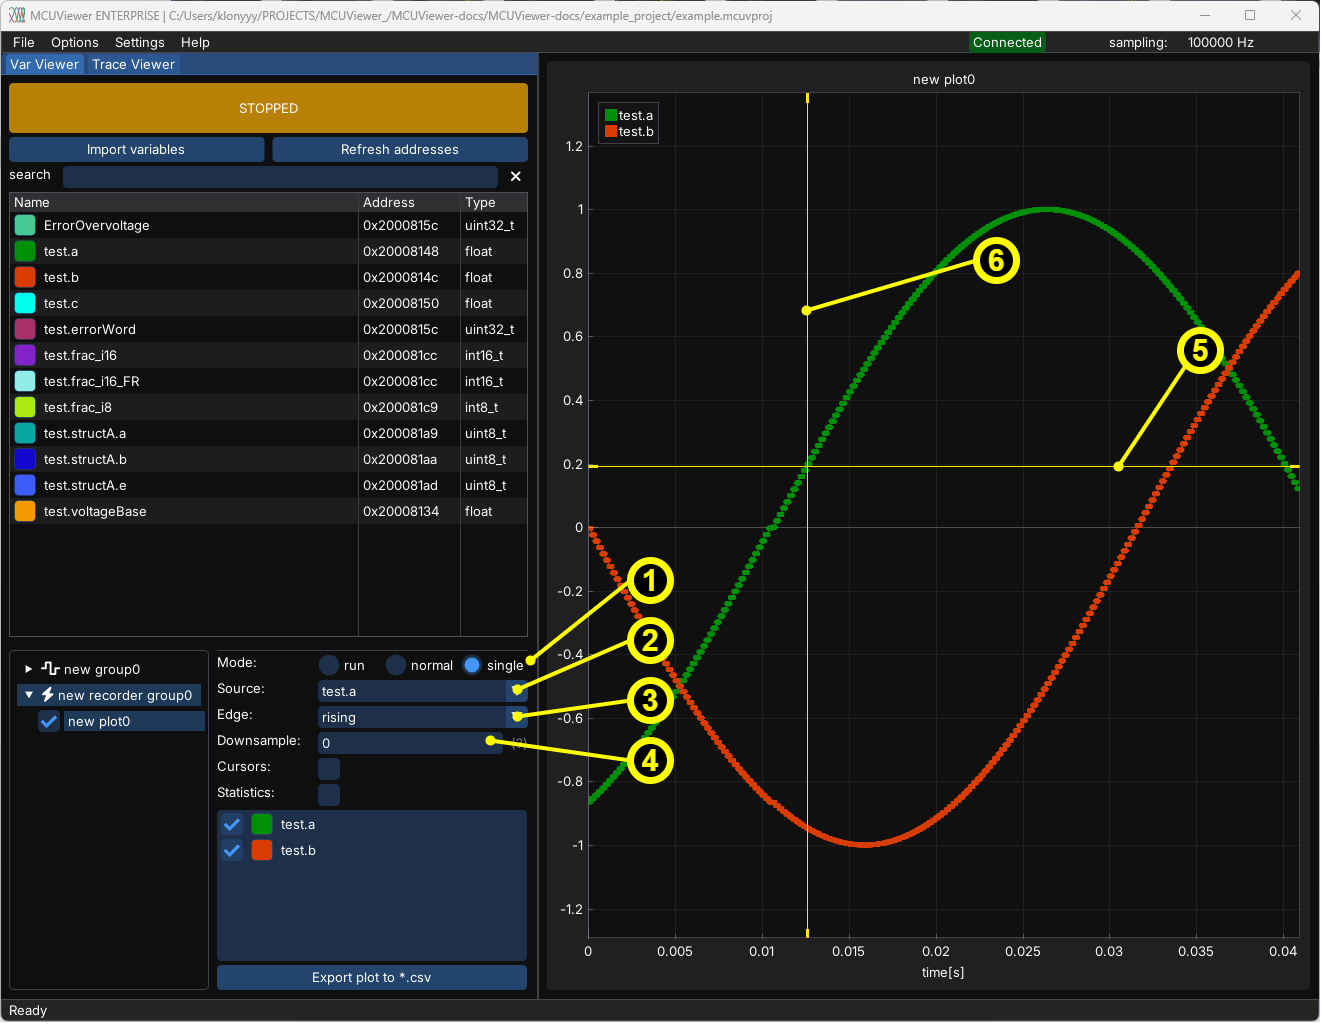
Mode- similarly to how oscilloscope works.Autowill continuously collect and display data,Normalwill display data on each trigger occurrence,Singlewill display data only once for trigger occurrence.Source- select the variable that will be used as a trigger signal.Edge-Risingwill display data on the rising edge,Fallingwill display data on the falling edge.Downsample- collect every Xth sample, allowing a longer acquisition window at the cost of reduced sampling rate.Trigger level drag line- use to set up the trigger level. If not visible, double-left-click on plot area to adjust zoom.Pretrigger drag line- use to set up the amount of pre-trigger data. If not visible, double-left-click on plot area to adjust zoom.